This case study analyzed by Rafiq Hamdi (Royal Meteorological Institute of Belgium, Brussels) concerns the correlation between urban sprawl and increased temperature.
List of Contents
Key points
- Urban sprawl and environmental consequences
- Urban heat island effect in Brussels
- Find more info about the concept of resilient city
Urban population growth and the environment
The Brussels Capital Region (BCR) in Belgium has experienced a rapid transformation of agricultural land and vegetation to built areas over the past century. There has been a rapid expansion of the city since the 1950s, caused by the use of cars as a new mode of transportation. In 2006 Sabine Vanhuysse studied the evolution of surface cover fractions over BCR and the results indicate a sharp increase in impervious surface areas, nearly doubling from 26% in 1955 to 47% in 2006.

Discover ARC3.3
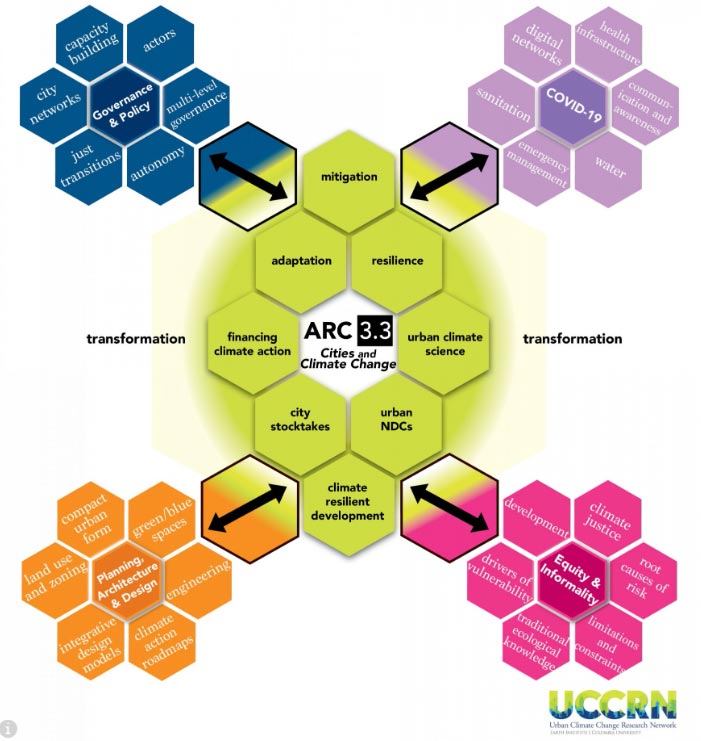
UCCRN edu is proud of its active participation in the development and dissemination of innovative content for ARC3.3, a publication by Cambridge University Press. Discover the new ARC3.3 release!
An example of heat waves effects: the Uccle suburb
The Royal Meteorological Institute of Belgium, at the same time, noted a gradual increase in temperature located just south of the center of the capital in the Uccle suburb. It is important to understand whether, and to what extent, estimates of warming trends at Uccle can be explained by the growth of the UHI of the city of Brussels due to urban sprawl.
Two stations belonging to the RMI (Royal Meteorological Institute), situated 13 kilometers away from the center of Brussels, are used to assess the degree to which the Uccle near-surface temperature trends are amplified by urbanization.
To define UHI intensity, we must consider the difference in near-surface air temperature between urban and rural stations.
The UHI effect on minimum temperature is shown to be rising with increased urbanization, with a linear trend of 0.18°C (± 0.02°C) per decade. The coefficient of determination is R2 = 0.70, which indicates a strong dependence between the increase of urban bias on minimum temperature and the changes in the percentage of impervious surfaces.
This image has been released by Rafiq Hamdi.
References
–Rosenzweig, C., Solecki, W., Romero-Lankao, P., Mehrotra, S., Dhakal, S., & Ali Ibrahim, S. (Eds.). (2018). Climate Change and Cities: Second Assessment Report of the Urban Climate Change Research Network, Cambridge University Press.
-Hamdi, R., A. Deckmyn, P. Termonia, G. R. Demarée, P. Baguis, S. Vanhuysse, and E. Wolff. “Effects of Historical Urbanization in the Brussels Capital Region on Surface Air Temperature Time Series: A Model Study.” Journal of Applied Meteorology and Climatology 48, no. 10 (2009): 2181–96.


